I read an interesting post regarding the Page View KPI no longer being part of the Web Analytics metrics in the future as Nielsen/NetRatings have decided to scrap Page views from their rankings. The article alleges that the Page View metrics is incapable of telling us about the overall user experience as nowadays most websites make use of widgets, videos , flash, AJAX content etc and it is impossible to measure those attributes with the use of Page Views. The article mentions “If you have widgets, you don't really have page views. If you do videos, you don't have page views.”
Will Page Views suffer the same fate as the Hits metrics? In the nascent stage of Web Analytics, Hits used to be the key metrics tracked in place of Page Views but as the Web Analytics community became mature, the Hits metrics was found wanting. This is because Hits measured everything from loading of images, CSS to JavaScript which meant that Hits will count all the individual requests and report them seperately which in turn was termed as inaccurate. One of the reasons why Hits noticed a quick exit was due to the fact that it could only be tracked via Server Logs and with the advent of conventional Web Analytics tools, it was easier to find a replacement in the form of Page Views.
Are Page views dead? Personally I think it is too early to say that. I say this because around 90% of the companies today would be using Page Views in their day to day reporting/dashboards and also all the major Web Analytics tools report this as a prime metrics. Page Views have been widely accepted as an industry standard and it would be really difficult to replace it immediately as a suitable replacement would not be easy to find. Though we have noticed in the past that Visits and Unique Visitors have been considered a better metrics than Page Views but it doesn’t really mean that we can totally discount Page Views as they have their own value in Web Analytics.
What can be the possible replacements for Page Views? I don’t think the existing prime metrics like Visits, Visitors would replace it but I agree with what was written in the article about User Engagement. User Engagement according to me is the Visitor experience on a webpage ranging from clicks on specific links, interaction with the embedded applications like Videos, Widgets etc and most importantly Time Spent. Based on my experience, I’ve noticed that majority of the exits on a website happen within the first 15 seconds and it is crucial for us to decrease the exit rate for this time range. Ideally in case of eCommerce websites, a user session should range between 5-10 minutes as I think by this time the user is well adept with the website interface. He would then decide to perform the appropriate task like filling a form to buying something. Similarly the user engagement metrics would be different for a content, classifieds and News website. So the Time Spent metrics is in a way a subset of User Engagement.
All in all I think it is too early to totally discount Page Views from Web Analytics but sooner or later the industry will decide to replace it. But whenever that happens, I sincerely hope that Page Views would be given a graceful exit unlike it’s predecessor Hits.
Tuesday, February 26, 2008
Sunday, February 17, 2008
Excel Alerts- A gift for Web Analysts
Microsoft Excel is the lifeline of most of the reporting done these days and it is imperative for an Analyst to present the data as visually as possible. So I’ll change gears this time and write about a very useful feature I learnt last week which I call as Excel Alert. This is not an in-built attribute in Excel but it resembles the properties of an Excel feature known as Conditional Formatting. This characteristic allows us apply formats like color, bold text etc on values in a cell or formula. For e.g. if we have 2 cells containing ratios, conditional formatting allows us to determine which is greater by highlighting either of the 2 cells in Red, Green or some other format.
This article will help you get introduced to yet another Conditional Formatting feature which will add more visual appeal to your reports. Instead of using CF we will make use of AutoShapes to determine a change in cell values. To accomplish this, let’s look at the below steps and screenshots:
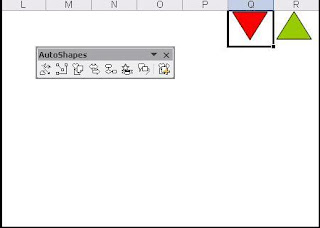
1) Open Microsoft Excel and go to Insert -> Picture -> AutoShapes. Choose Basic Shapes and select Isosceles Triangle from the list (You can choose the shape of your choice). Select a cell and draw the shape in that cell (I have merged 3 cells and accommodated the shape) and rotate the shape of the Triangle if you want. Right click on the Triangle, select Format AutoShape and under the Fill section choose the color of your choice which in my case happens to be Red. Copy the Red Triangle, paste it in another cell and change the color of the shape to a different color. So now I have 2 shapes in Red and Green. Look at the screenshot.
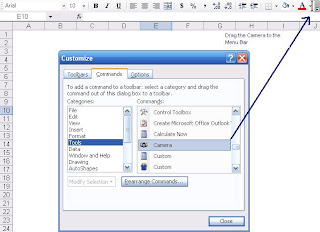
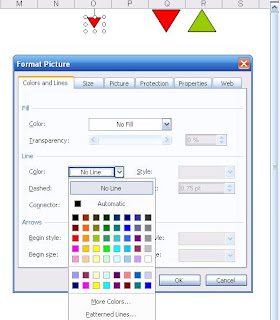
2) Next you need to go to Tools -> Customize and select Tools on the Left to view the goodies in the right section. Choose the Camera tool from this list and drag it to the Menu bar. Now select the cell with the AutoShape and click on the Camera icon. Start drawing the shape again and you will find a replica of the AutoShape you first created. Then as you can see in the screenshot, right click on the newly captured AutoShape and choose Format Picture. In the Colors and Lines tab, choose the No Fill and No Line options from the Fill->Color and Line->Color drop downs respectively. This will get rid of the outer boundary of your captured AutoShape. Have a look at the screenshots below to follow the steps.
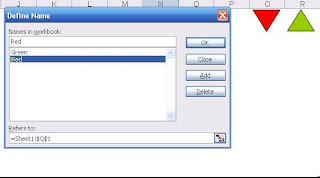
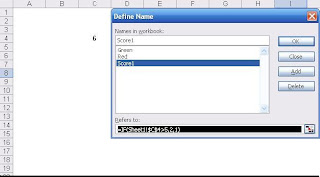
3) Then we need to name our 2 AutoShapes which we can do by going to Insert-> Name-> Define. Once there, we need to define the cells where the 2 Shapes are placed. In my case, I have referenced the cells and named them according to the color of the Shapes. This step is really crucial because we uniquely define the Shapes as these are the definitions by which we will be referencing them.
4) Now let’s look at the final step which deals with the definitions of the Alerts. First we have to define the cell where we will be displaying the number with name ‘Score1’ and statement = IF(Cell-value>5, 2, 1). The simple IF statement in the example validates the condition which in this case means if number is greater than 5 then choose 2 else choose 1. Finally we need to define the Alert which will be displayed next to the number validating the condition. Please look at the Step 4a image which shows that we have defined the Alert1 with the formula =Choose(Score1,Red,Green). This formula is helpful in providing an alias for the numbers used in the previous IF statement. So 1 means Red and 2 means Green.
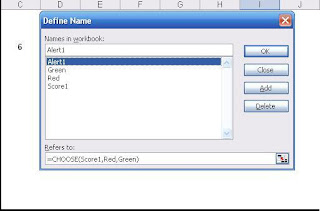
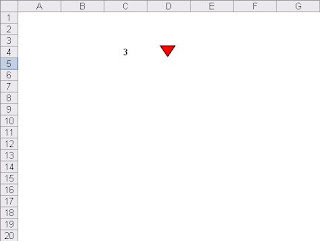
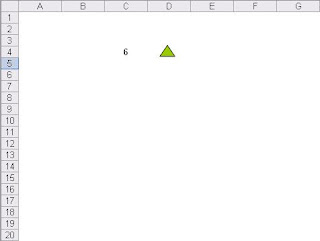
5) Now if we change the values in Cell C3 to a number lower than 5, we will see the Alert as Red and vice versa. Please look at the final 2 images which will give you an idea as to how these changes will take effect.
You can also download this file here. I hope you like this post as I think it was a refreshing change from the usual topics.
This article will help you get introduced to yet another Conditional Formatting feature which will add more visual appeal to your reports. Instead of using CF we will make use of AutoShapes to determine a change in cell values. To accomplish this, let’s look at the below steps and screenshots:
1) Open Microsoft Excel and go to Insert -> Picture -> AutoShapes. Choose Basic Shapes and select Isosceles Triangle from the list (You can choose the shape of your choice). Select a cell and draw the shape in that cell (I have merged 3 cells and accommodated the shape) and rotate the shape of the Triangle if you want. Right click on the Triangle, select Format AutoShape and under the Fill section choose the color of your choice which in my case happens to be Red. Copy the Red Triangle, paste it in another cell and change the color of the shape to a different color. So now I have 2 shapes in Red and Green. Look at the screenshot.

2) Next you need to go to Tools -> Customize and select Tools on the Left to view the goodies in the right section. Choose the Camera tool from this list and drag it to the Menu bar. Now select the cell with the AutoShape and click on the Camera icon. Start drawing the shape again and you will find a replica of the AutoShape you first created. Then as you can see in the screenshot, right click on the newly captured AutoShape and choose Format Picture. In the Colors and Lines tab, choose the No Fill and No Line options from the Fill->Color and Line->Color drop downs respectively. This will get rid of the outer boundary of your captured AutoShape. Have a look at the screenshots below to follow the steps.


3) Then we need to name our 2 AutoShapes which we can do by going to Insert-> Name-> Define. Once there, we need to define the cells where the 2 Shapes are placed. In my case, I have referenced the cells and named them according to the color of the Shapes. This step is really crucial because we uniquely define the Shapes as these are the definitions by which we will be referencing them.

4) Now let’s look at the final step which deals with the definitions of the Alerts. First we have to define the cell where we will be displaying the number with name ‘Score1’ and statement = IF(Cell-value>5, 2, 1). The simple IF statement in the example validates the condition which in this case means if number is greater than 5 then choose 2 else choose 1. Finally we need to define the Alert which will be displayed next to the number validating the condition. Please look at the Step 4a image which shows that we have defined the Alert1 with the formula =Choose(Score1,Red,Green). This formula is helpful in providing an alias for the numbers used in the previous IF statement. So 1 means Red and 2 means Green.


5) Now if we change the values in Cell C3 to a number lower than 5, we will see the Alert as Red and vice versa. Please look at the final 2 images which will give you an idea as to how these changes will take effect.


You can also download this file here. I hope you like this post as I think it was a refreshing change from the usual topics.
Sunday, February 10, 2008
Debugging your Web Analytics Code
I came across a question on Yahoo Web Analytic Group regarding debugging tracking code on a webpage without having access to the Web Analytics tool. The answers to this question can be more than one but based on my experience, the best way to check Web Analytics code on a page is to use a Packet Sniffer.
A Packet Sniffer or HTTP/JavaScript Debugger as it is known is a tool that analyzes and parses network traffic. There are many other uses of a Packet Sniffer but in this case we are only looking at capturing HTTP/JavaScript packets. So if I have a webpage containing Google Analytics code, all I need to do is activate this software while the webpage is being loaded. Once the entire code snippet on the page has been loaded, you can go to the Packet Sniffer tool and search for the Google Analytics code from the list of captured packets.
Let us look at an example by going to www.msn.com and capturing the Omniture Web Analytics tag on their webpage using a tool called Fiddler. Please look at the 2 screenshots captured after the MSN-US page load was complete.
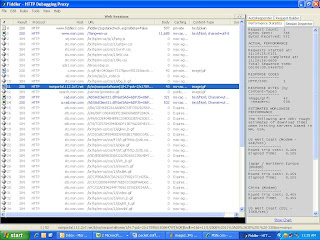
The first image is an overall summary of all the code being rendered with the Omniture code highlighted in Blue. Please note that for an Analytics JavaScript code to be successfully rendered, it has to make a ‘Status 200' call to the respective Datacenter meaning the request has been completed. Now double click on the captured snippet and look at the second screenshot for the next step.
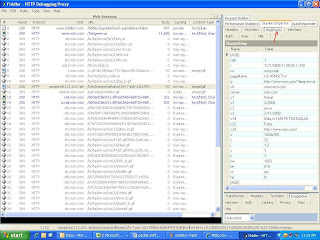
After double clicking on the Omniture code, you will have to click on the Web Forms tab on the top right in order to view the various parameters being passed onto Omniture. You will notice all the various parameters being sent to Omniture like the Page name, Language, Screen resolution and so on. This step will also tell us whether the custom variables we passed on the analytics code are being sent correctly or not.
Packet Sniffers have a very important role to play in Web Analytics as they can help fix issues like data not being present in the reports to discrepancy in numbers. Finally listed below are a few more HTTP Debugger tools that I’m aware of:
1) Adobe Experience Cloud Debugger
2) Charles Proxy
3) Debugger for Adobe Analytics
Sunday, February 3, 2008
A peek at Digital Advertising Banners
My last post mentioned the various Web Advertising deals that take place between advertisers and publishers. This post will help us understand what is pivotal in ensuring that these deals are successful. You must have come across various advertising banners displayed on websites like Yahoo, MSN etc. We will now take a closer look at the different kinds of Web Banners present today.
1) Banners and Skyscrapers: Banners were one of the first Web Adverting units introduced in the Internet. They are complied of specific measurements which can range from 234*60 to 468*60 pixels. They are created from JPEG, GIF images and will generally be displayed on the top just below the heading of a website or at the bottom. However while scrolling down the webpage we might loose sight of them as they are mostly displayed on top. Skyscrapers/Sidebars on the other hand are tall Ad units displayed on the right or left portion of the webpage making them visible throughout the scrolling process. They are mostly displayed as 120*600 pixel banners. It is therefore essential to select the kind of banner you want to display on your website depending on its CTR (Click through Rate). Google Adwords and Adsense make use of various banners that are displayed on its search results and publishing websites respectively.
2) Floating Ad Units and Multimedia Ads: Floating Ads are displayed once a visitor lands on the homepage and these units are known to travel on the page during the scrolling process. They are usually designed in Macromedia Flash to draw the attention of the user and entice him to click. However they can be annoying for a lot of users as they completely superimpose the text area on the Webpage. Multimedia or Unicast Ad is typically displayed as an animated video/audio message designed especially to replicate a television.
3) Popups and Pop Unders: Popups are banners that are displayed in the form of a new browser window displayed onto our screen. It is immediately displayed after a user visits a website. However a Popunder browser window opens itself underneath the parent website usually getting unnoticed during the initial entry to the website. Again they are designed primarily to grab the user attention and encourage him to click. These Ad units are known to be more successful than Banners and Floating Ad units in terms of getting more clicks.
4) eCommerce Widgets: A Widget is a snippet of code that can be embedded in a website and it is the latest inclusion in the ever-growing Web Advertising field. For e.g. An Amazon widget can added to a webpage for selling books, software etc. The Widget advertising model almost follows the PPA (Pay per Acquisition) which is described in my last blog post. So if a user buys a book through a widget embedded on a website, the publisher will be entitled to receive a portion of the Book cost. I recently read an article mentioning about a Widget called the ‘Paypal Storefront Widget’ which is especially made for Blogs and Social Networking websites. This widget offer services such as in-widget shopping carts, product description, thumbnail gallery etc. Unfortunately this widget is only available for Typepad Blog users. Widgets like these help tap the enormous potential of eCommerce and with such tools Internet can only get better.
These were some of the banners which are the most prevalent today and it should be noted that there will be newer and more creative Web banners that will hit the Internet sooner or later. Having more and more of these banners on your webpages will obviously enhance your earnings but we should always draw a line between the acceptable and uncomfortable user experience which according to me is of the utmost importance. I hope you like this post and if possible share your opinions.
Subscribe to:
Posts (Atom)